

Consumer Price Index (CPI):
June (Tuesday)
Consumer inflation slowed more than expected last month, due in large part to falling energy prices. Despite the drop in headline inflation, core prices were flat.
- Prior monthly CPI/core CPI growth: +0.5%/+0.2%
- Expected monthly CPI/core CPI growth: –0.1%/+0.2%
- Actual monthly CPI/core CPI growth: –0.4%/+0.0%
- Prior year-over-year CPI/core CPI growth: +4.2%/+2.9%
- Expected year-over-year CPI/core CPI growth: +3.8%/+2.8%
- Actual year-over-year CPI/core CPI growth: +3.5%/+2.6%

Producer Price Index (PPI):
June (Wednesday)
Producer price growth also came in below economist estimates last month. Although inflation remains well above the Fed’s 2 percent target, last month’s reports were an encouraging step in the right direction.
- Prior monthly PPI/core PPI growth: +0.6%/+0.1%
- Expected monthly PPI/core PPI growth: +0.0%/+0.3%
- Actual monthly PPI/core PPI growth: –0.3%/+0.2%
- Prior year-over-year PPI/core PPI growth: +6.0%/+4.6%
- Expected year-over-year PPI/core PPI growth: +6.2%/+5.1%
- Actual year-over-year PPI/core PPI growth: +5.5%/+4.7%

Retail Sales:
June (Thursday)
Retail sales growth slowed last month, with core sales missing expectations. This marks five consecutive months of sales growth.
- Expected/prior monthly retail sales change: +0.2%/+1.0%
- Actual monthly retail sales change: +0.2%

Preliminary University of Michigan Consumer Sentiment Survey:
July (Friday)
Consumer sentiment improved more than expected to start July, due in part to better expectations for future economic conditions amid declining oil prices.
- Expected/prior consumer sentiment: 51.0/49.5
- Actual consumer sentiment: 54.4
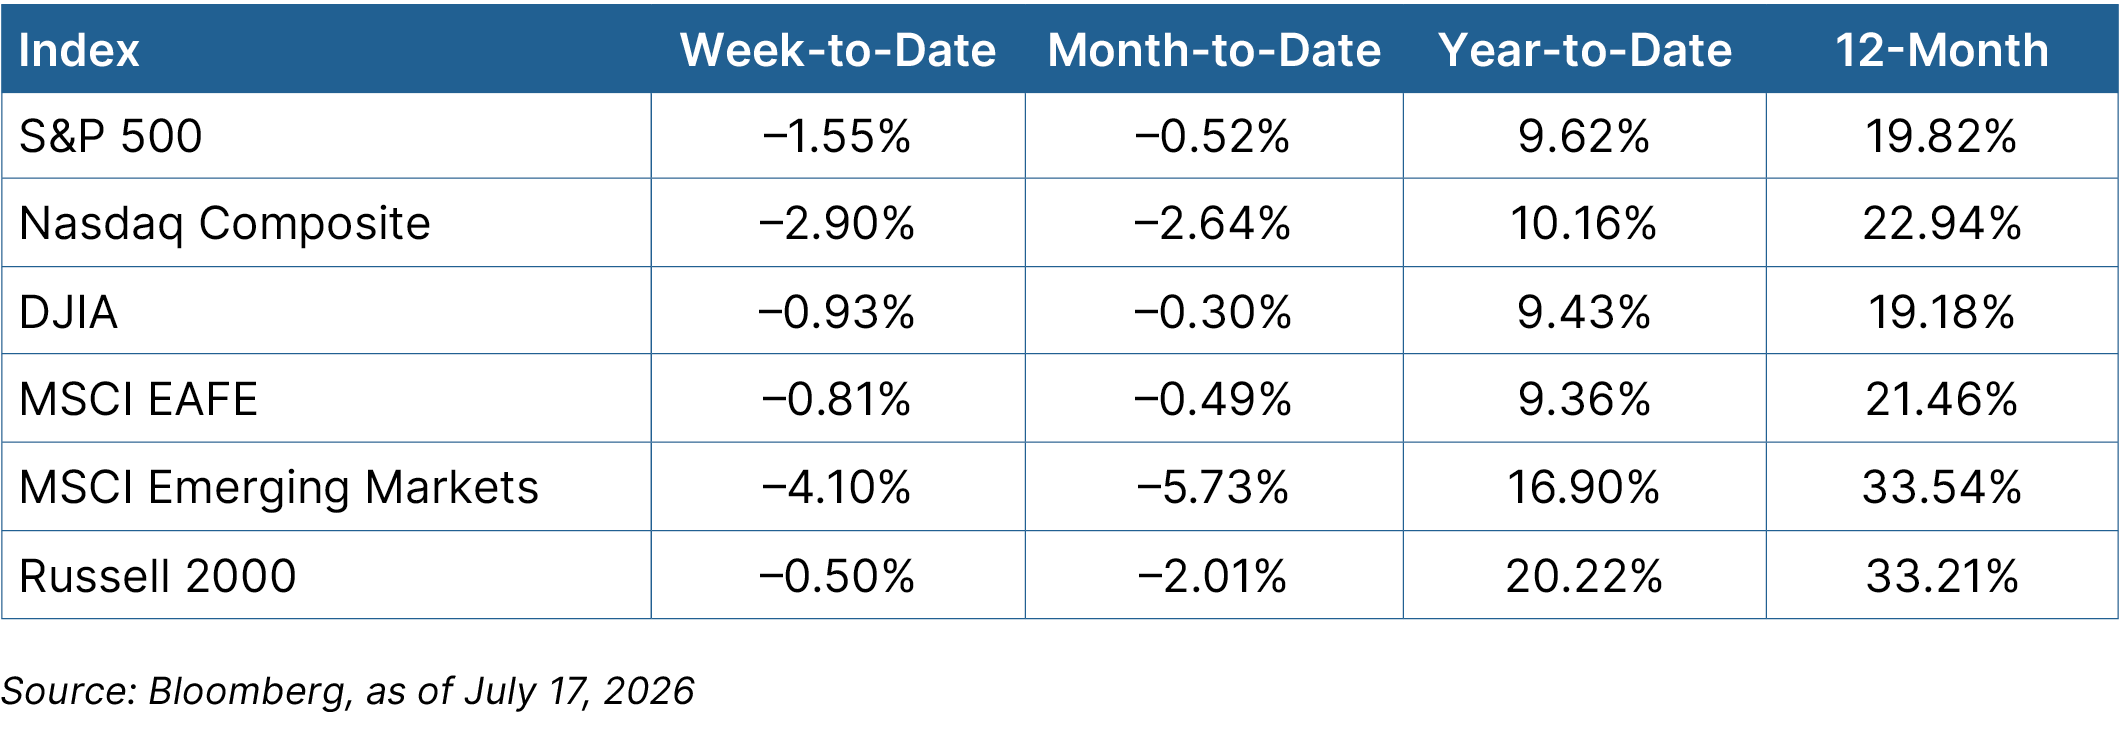
Equity
A sell-off in technology and AI stocks dragged down global markets. The Nasdaq Composite and the S&P 500—down almost 3 percent and 1.5 percent, respectively—led U.S. markets lower. The Dow Jones Industrial Average and the Russell 2000 each declined less than 1 percent. With oil prices rising nearly 15 percent, energy was the best-performing sector, rising nearly 5 percent. Technology (down 3.8 percent) and communication services (down 2.4 percent) were the weakest sectors. International markets were also lower, with developed markets down less than 1 percent and emerging markets down more than 4 percent.
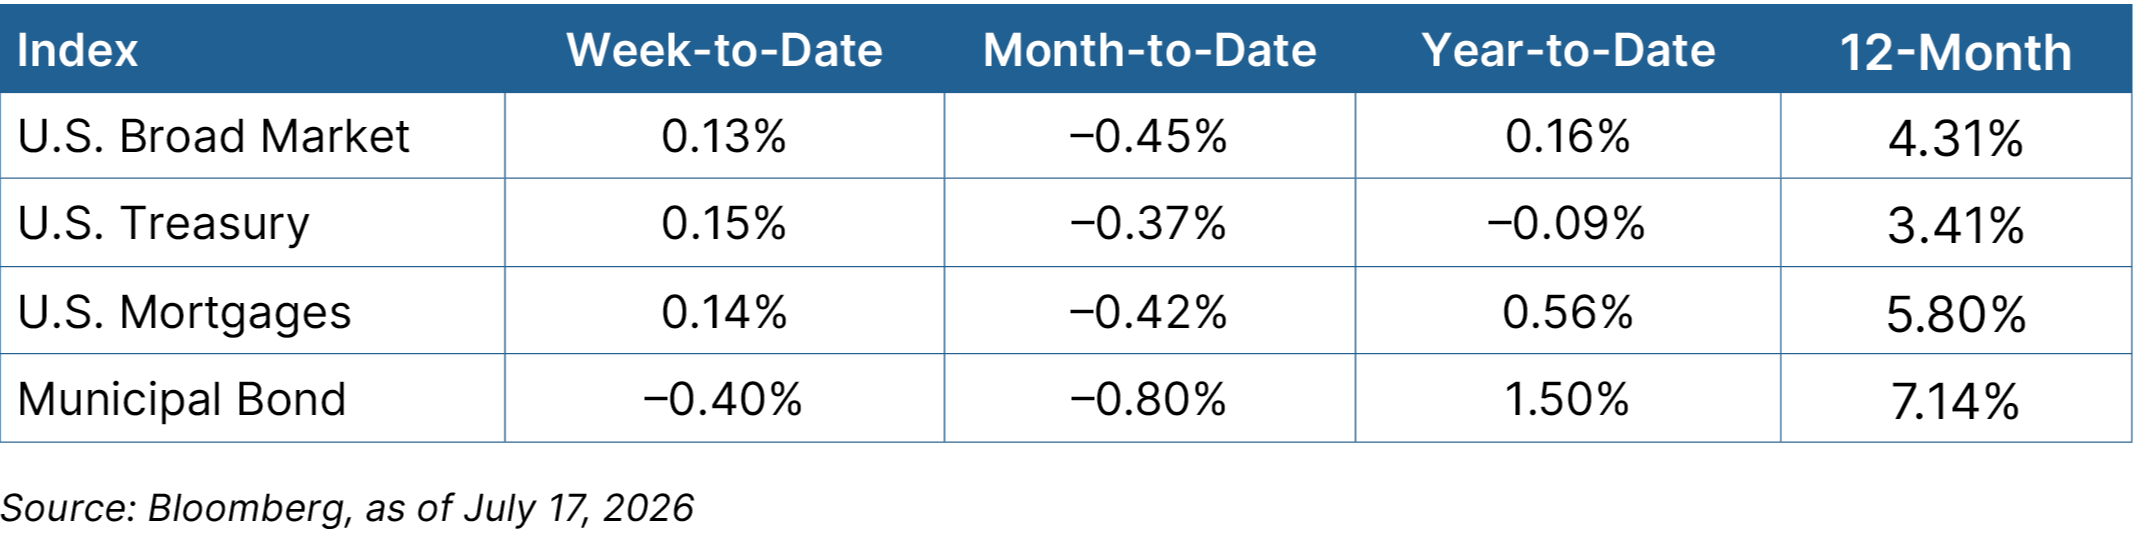
Fixed Income
Improving inflation readings and a weak stock market provided a positive backdrop for fixed income investors. Core bonds and Treasuries moved marginally higher. The 10-year Treasury yield closed essentially unchanged at 4.57 percent. Municipal markets were lower but declined only 0.4 percent.

Looking Ahead
With no major economic reports scheduled this week, investors will shift their focus elsewhere. Updates from the Middle East that could affect the Strait of Hormuz and oil prices will be critical. Second-quarter earnings reports will begin to accelerate.
- Investors will watch second-quarter earnings updates from Alphabet, Tesla, and Intel.